How static and dynamic code analysis helped delete over 200,000 lines of dead code from a large-scale train ticketing app built with Redux, RxJS, and normalizr — before React Hooks existed.
Background
A large online train ticket sales platform had accumulated significant technical debt over several years of rapid feature development. The frontend stack — built before React Hooks existed — relied on Redux for state management, RxJS for async event streams, and normalizr for data normalisation.
The codebase had a few deep-rooted problems:
- Impure reducers and RxJS operators introducing side effects in places where pure functions were expected
- Hot vs cold observable confusion causing a single user action to fan out into dozens or hundreds of unintended event emissions
- Broken selector memoisation — selectors calling
Date.now()or constructing new object literals on every invocation, defeatingreselect's cache entirely - Accumulated dead code from A/B tests that shipped, were evaluated, and were never cleaned up
The consequence was brutal: thousands of unnecessary re-renders per interaction, sluggish UI, and a codebase that was increasingly hard to reason about.
Investigation
Static Code Analysis
The first pass was static. We wrote a Babel-based parser that walked the AST and matched against naming conventions to build a graph of how Redux actions, reducers, selectors, and RxJS streams connected to each other.
This worked well for straightforward patterns, but the codebase used dynamic imports inside RxJS pipelines:
// Pattern that defeated static analysis
const action$ = name$.pipe(
  mergeMap(name => import(`./actions/${name}/`))
);
Static analysis couldn't resolve name at parse time, so entire branches of the event graph were invisible. We could understand most of the data flow, but not enough to act on it safely.
Dynamic Code Analysis
To fill the gaps, we built a proxy-based runtime tracer. A Proxy object was injected at the Redux store boundary and propagated down through every selector invocation. Each property access on the proxy was recorded, building a precise map of:
- which store fields each selector actually read
- which selectors were called during any given user interaction
- which selectors were never called at all
This gave us the complete picture that static analysis couldn't: a field-level dependency graph between the Redux store and the UI.
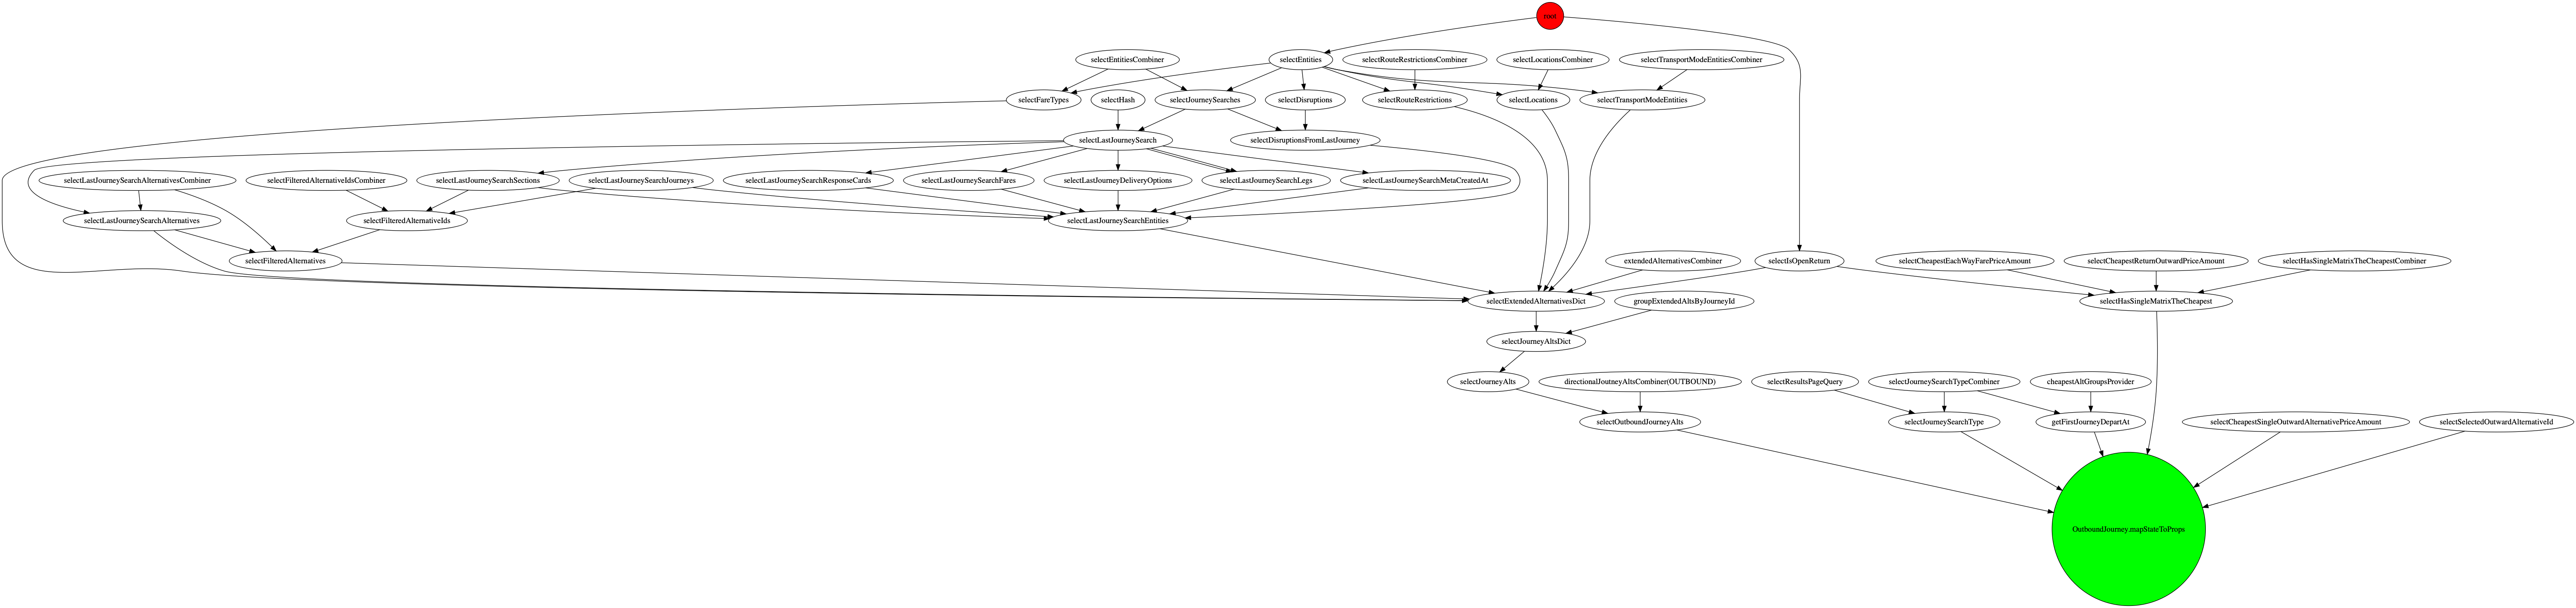
To appreciate why this matters, consider the OutwardJourney selector as an example. It required modifying a field at the root of the Redux store — which was read by ~50 out of ~2100 selectors scattered across the codebase. Tracing every file that could possibly be affected was a manually unmanageable task without tooling.
Path-tracking proxy
The proxy wraps any object and records every property access as a dot-separated path. Nested accesses are wrapped lazily, so state.user.profile.name produces the path "user.profile.name" without any up-front schema knowledge.
function createTrackingProxy(target, onAccess, path = '') {
  return new Proxy(target, {
    get(obj, key) {
      if (typeof key === 'symbol') return obj[key]

      const fullPath = path ? `${path}.${key}` : key
      onAccess(fullPath)

      const value = obj[key]
      if (value !== null && typeof value === 'object') {
        return createTrackingProxy(value, onAccess, fullPath)
      }
      return value
    },
  })
}

// Usage
const accessed = new Set()
const trackedState = createTrackingProxy(reduxStore.getState(), p => accessed.add(p))

someSelector(trackedState)
console.log([...accessed])
// e.g. ["user.id", "user.profile.name", "tickets.byId"]
Wrapping selectors with createSelector
Rather than each selector file opting in to tracing individually, we replaced the createSelector import with a drop-in wrapper that transparently enabled tracing via an env flag. Individual selectors required no changes at all:
import { createSelector } from './selector'

// plain mapping function — no tracing logic here
export const _selectUserName = state =>
  `${state.user.profile.firstName} ${state.user.profile.lastName}`

// createSelector registers the function under its name and wraps it when needed
export const selectUserName = createSelector(_selectUserName)
The selector.js module held both the tracingSelector implementation and the createSelector factory. The env flag lived here and nowhere else:
import { createSelector as _createSelector } from 'reselect'

export const accessLog = {}  // selectorName -> Set of accessed paths
export const callLog   = {}  // selectorName -> array of { args, result }

function tracingSelector(name, selector) {
  return function traced(state, ...args) {
    const accessed = new Set()
    const trackedState = createTrackingProxy(state, p => accessed.add(p))

    const result = selector(trackedState, ...args)

    accessLog[name] = accessLog[name] ?? new Set()
    for (const p of accessed) accessLog[name].add(p)

    callLog[name] = callLog[name] ?? []
    callLog[name].push({ args, result })

    return result
  }
}

// Drop-in replacement for reselect's createSelector.
// When TRACE_SELECTORS is set, wraps the input selector with the tracer
// using the function's name as the key. Otherwise delegates to reselect as-is.
export const createSelector =
  process.env.TRACE_SELECTORS === 'true'
    ? (selector, ...args) => tracingSelector(selector.name, _createSelector(selector, ...args))
    : _createSelector
After exercising the app (running the test suite, clicking through key flows), accessLog contained a complete map:
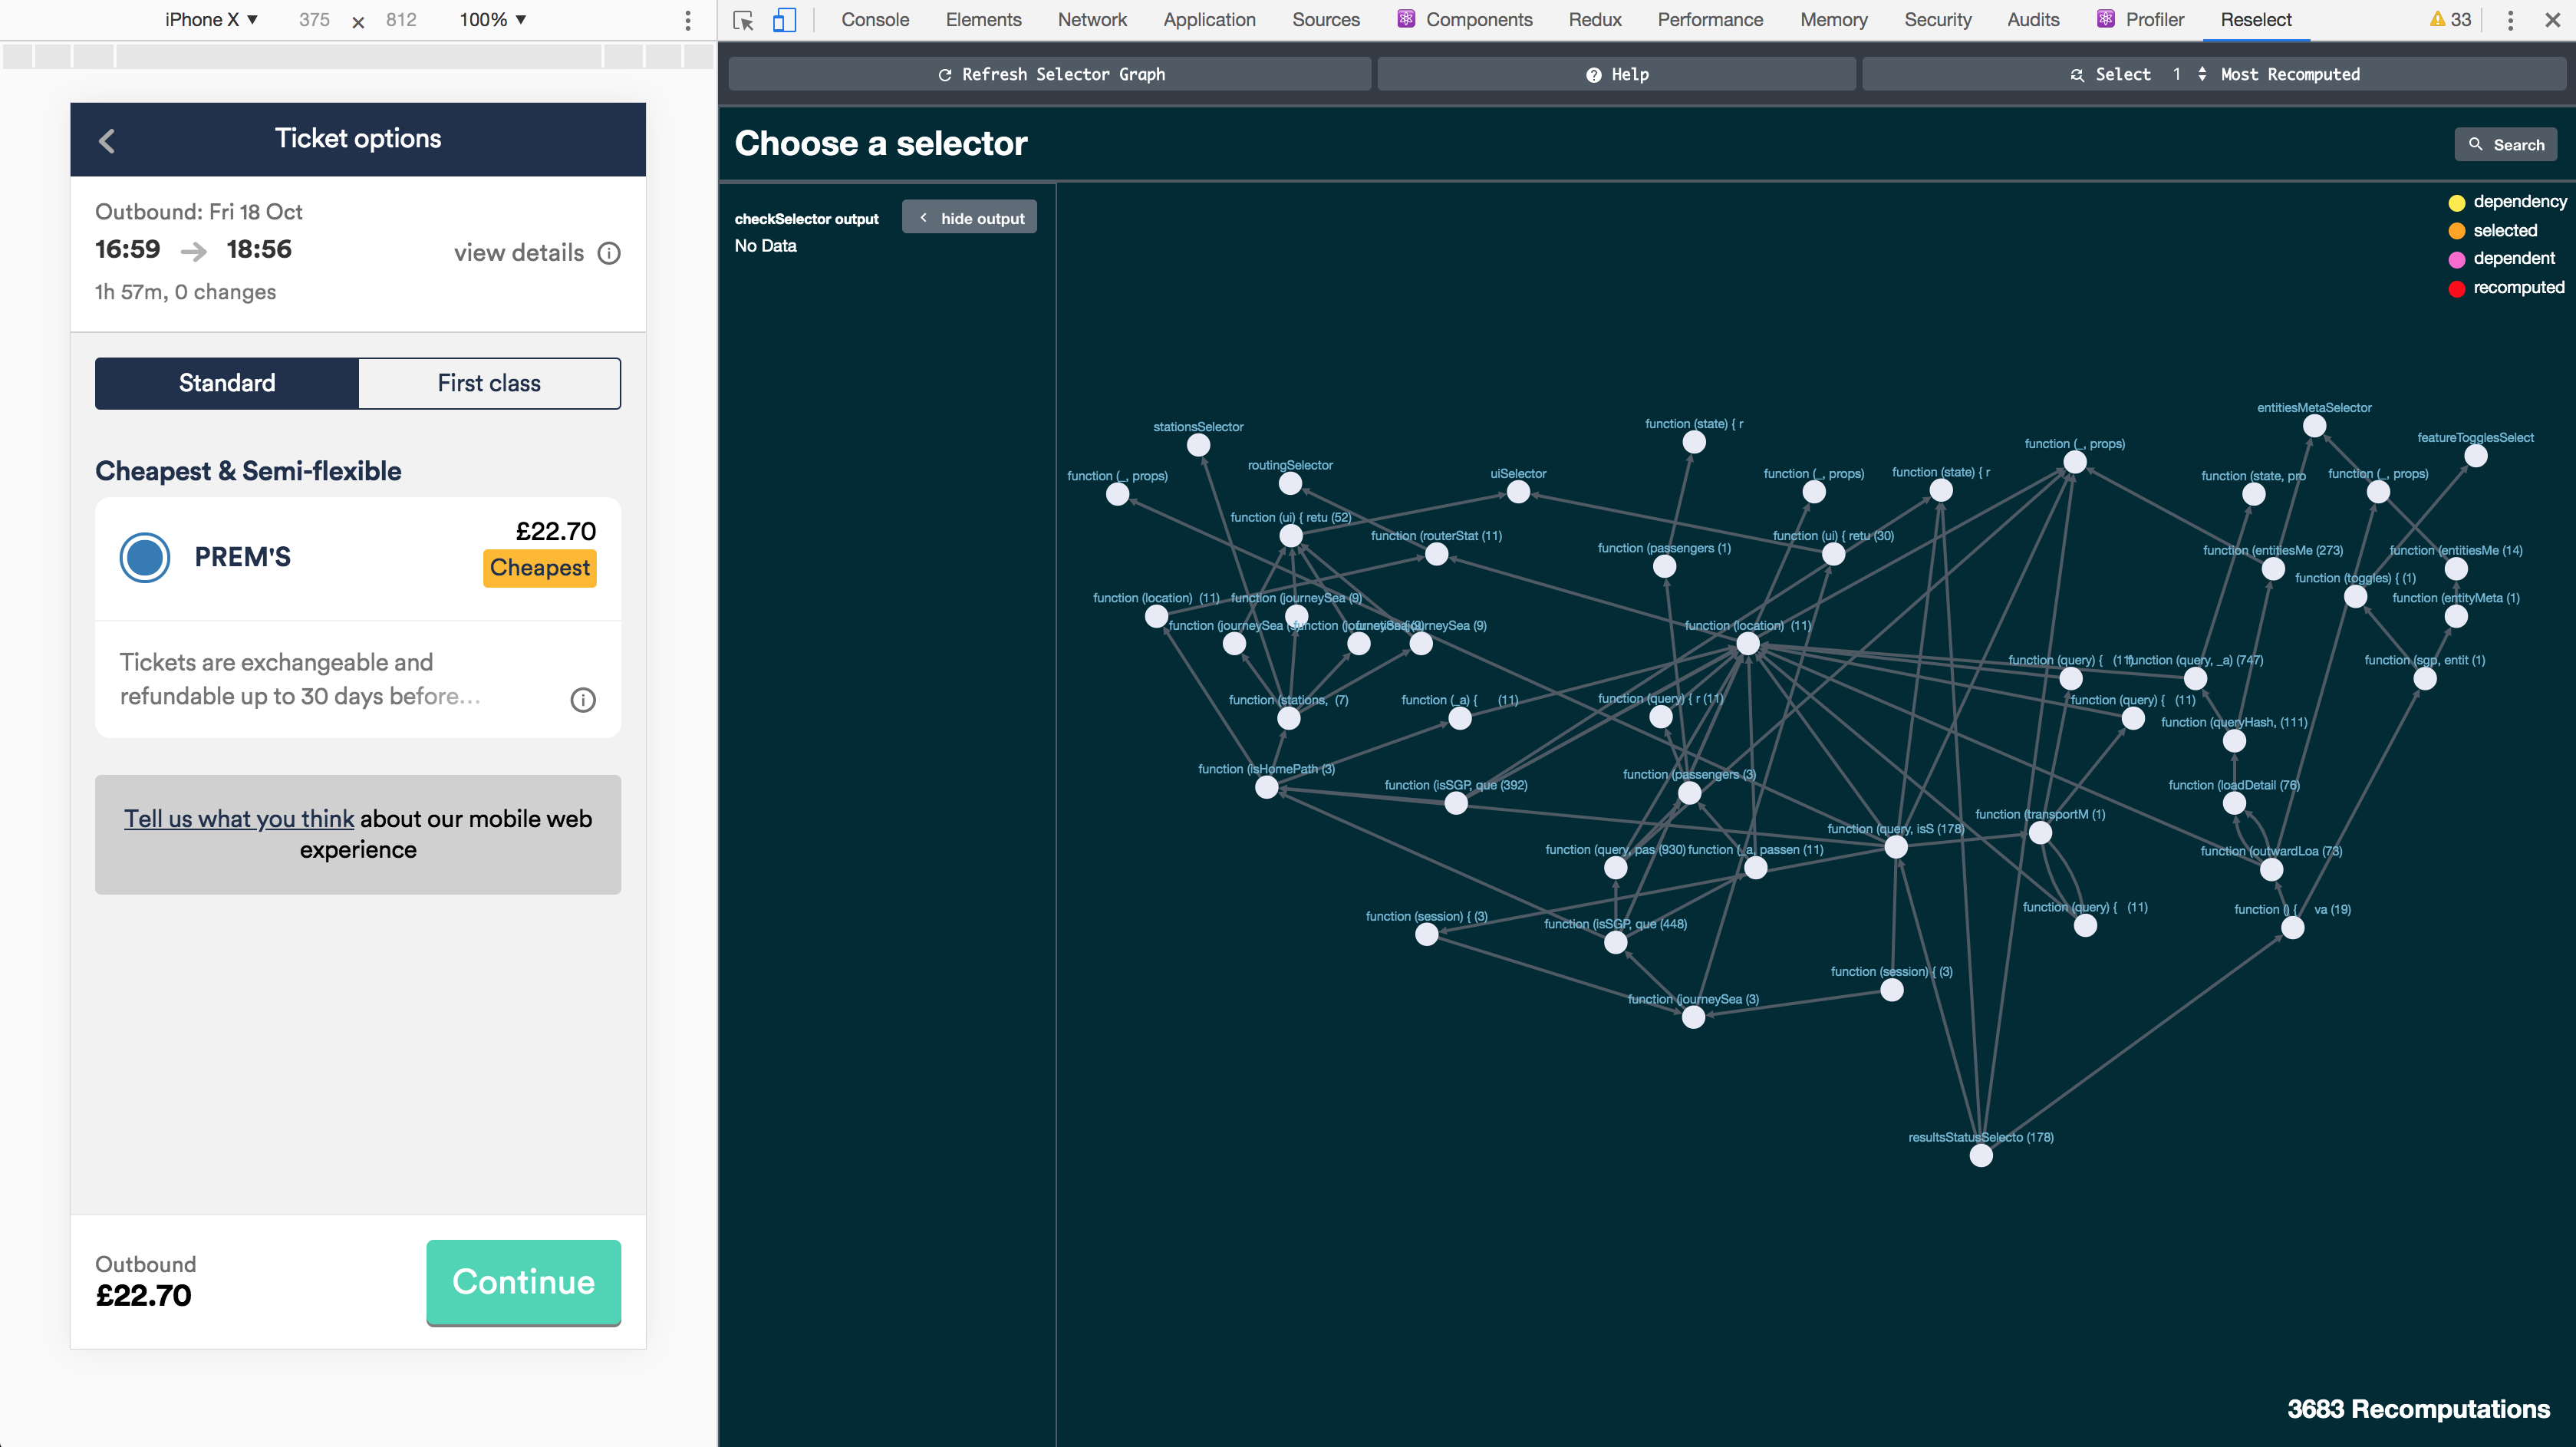
The selector dependency data was also surfaced directly in Redux DevTools. We forked the extension to enrich it with extra information from both the static and dynamic analysis — showing not just current state, but which selectors depended on which store fields, and which ones had never been called.
{
  selectUserName:       Set { "user.profile.firstName", "user.profile.lastName" },
  selectActiveTickets:  Set { "tickets.ids", "tickets.byId" },
  selectThemeColor:     Set {},   // never read anything — dead selector
}
Any selector whose access set was empty after a full test run was a safe deletion candidate. Selectors that read fields no reducer ever wrote were flagged as stale. The combination made the dead-code pass surgical rather than speculative.
Caveats
This approach works precisely because JavaScript is single-threaded: a selector invocation runs to completion before any other code touches accessLog, so there are no race conditions when accumulating paths.
The deeper limitation is branch coverage. The proxy can only record paths that are actually traversed at runtime. Consider:
const selectValue = state => state.cond ? state.x : state.yIf every test run and every click-through happens to have state.cond === true, the tracer will record state.cond and state.x — but state.y will never appear in the log, even though the selector depends on it. Deleting state.y from the store would be a silent bug.
This is exactly where static analysis is stronger: it can see all branches in the source regardless of which path executes. The two techniques are complementary. Dynamic analysis gave us high-confidence deletions for the paths it did cover; static analysis filled in the conditional branches it could not.
In practice, the union of unit tests, integration tests, and manual click-through gave sufficient coverage that we were comfortable acting on the tracer output — but we always cross-referenced against the static graph before deleting anything the dynamic tracer hadn't seen accessed at all.
The combined analysis was also used to generate searchable documentation of the selector dependency graph. Developers could look up any individual selector and immediately see what store fields it read, which other selectors depended on it, and which selectors it called — making it possible to understand the blast radius of any change without reading source code.
With both analyses combined, we could confidently answer:
"Is anything in the app actually reading this slice of state?"
Outcome
The project ran for six months as a joint effort across the frontend team.
- 200,000+ lines of code deleted — dead A/B test branches, unused selectors, orphaned reducers, and redundant RxJS pipelines
- Re-render counts dropped by orders of magnitude once broken memoisation was fixed and observable hot/cold semantics were corrected
- The cleaned-up codebase made the RxJS 5 → 6 migration tractable — removing dead streams meant far fewer operators to migrate and far fewer edge cases to reason about
The proxy tracer turned out to be the key insight: rather than trying to infer usage from source text, we let the runtime tell us exactly what was used.
Related Articles
From Legacy to Monorepo: Migrating a White-Label Credit Card Platform (2021–2024)
A four-year case study of migrating a white-labeled credit card platform from a legacy Angular/C# stack to a React monorepo with single-spa — covering GraphQL BFFs, micro-frontends, build parallelization, and the people problems that matter more than the tech ones.
From DIY Monorepo to Nx: Lessons from a White-Label Credit Card Platform (2024)
Part 2 of a multi-year migration case study. After building a homegrown monorepo toolchain, we adopted Nx — and discovered that its opinionated approach solves some problems elegantly while creating new ones when your apps can't truly be isolated.
React vs SolidJS: Dynamic Graphs, Static Graphs, and the Price of Flexibility
React and SolidJS share JSX syntax but are built on fundamentally different computational models. Understanding why illuminates a much older tension in functional programming — and an eerily similar split that once divided PyTorch from TensorFlow.